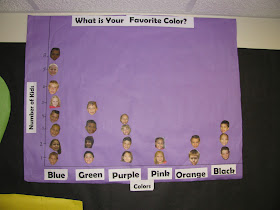
 Every year I like to do a graphing review to remind my students about the different types of graphs people use to organize data. During the school year we follow math pacing guide and I think that the graphing unit is far to late in the school year. I try to squeeze in my own review earlier in the year so that we can use the different types of graphs throughout the school year. Today I will share a fun way to review the different types graphs with your students, inspired by something similar I stumbled across online.
  I split my class up into 5 groups during our small group instruction time. Each group was assigned a type of graph and then had to come up with a survey question for their peers to answer. Once they had their question written down, I gave each group a class list sheet and they moved around the room to gather their data...a.k.a. ask their question to all of their peers.
Once they collected their data, they set out to make their graphs. Students ended up making a pie graph, a horizontal pictograph, a vertical pictograph (similar to a bar graph), and for fun one group made a Venn Diagram (they asked if they could and I thought it would be an interesting way to display their data)
Each group was given a different colored piece of bulletin board paper and they had to plan out how they wanted to organize their data. Each group then received pictures of their classmates (just color printed in the
computer lab) to cut out. I purposefully gave the pie graph to a group of kids who would be able to problem solve how to create a more challenging graph. They ended up splitting up their circle into equal pieces based on the total number of students in our class. Then they used a dark marker line to partition off the different sections based on their data. Once they were all finished, they presented their findings to the class and we hung them up. Once finished, they are so much fun to look at and they definitely catch your eye on the way by!
I also have a few resources I have created to help my students review their graphing. I have shared them with all of my third grade colleagues and they were thrilled because it meant they didn't have to reinvent the wheel! Here are two bundles:


No comments:
Post a Comment